You’re Measuring Your Meta Ad Performance Wrong - Here’s How to Fix it
Your ads might not be doing as well as you think because you’re measuring wrong
If you're the CEO of a business spending thousands Meta ads, there are silent killers that might be in your ad account—and it’s not your creative, your media buyer, or even Meta itself.
It’s your measurement.
Not what you think you're measuring. Not the tidy ROAS figures your ad account shows you. But the actual impact that your ads are having and the economic levers that make your business work. And if you don’t understand this, your media budget might as well be a bonfire.
This article will unpack this in more detail and give you actionable steps you can take today, because fixing this will unlock profitable scale—and it’s the highest-leverage thing you can do this quarter (you might also find that your ad agency has been misleading you on how well ads are performing).
Do This Right Now…Audit Your Attribution Windows
First things first, I’m going to show you how to go into your Meta ad account and look at your attribution window comparison breakdown, which is easy to do even if you’ve never navigated your Meta ad account before. This will help you show the extent to which Facebook ads might be over reporting results.
Why is this important?
Because this is the first step in starting to understand the real impact of your ads. You’ll learn the difference between 1-day view, 1-day click & engaged, 7-day click, 28-day click, Incremental attribution and why they’re crucial to understanding true ad performance.
Step 1: Go to ads manager and select Columns > Compare Attribution Settings at the very bottom.
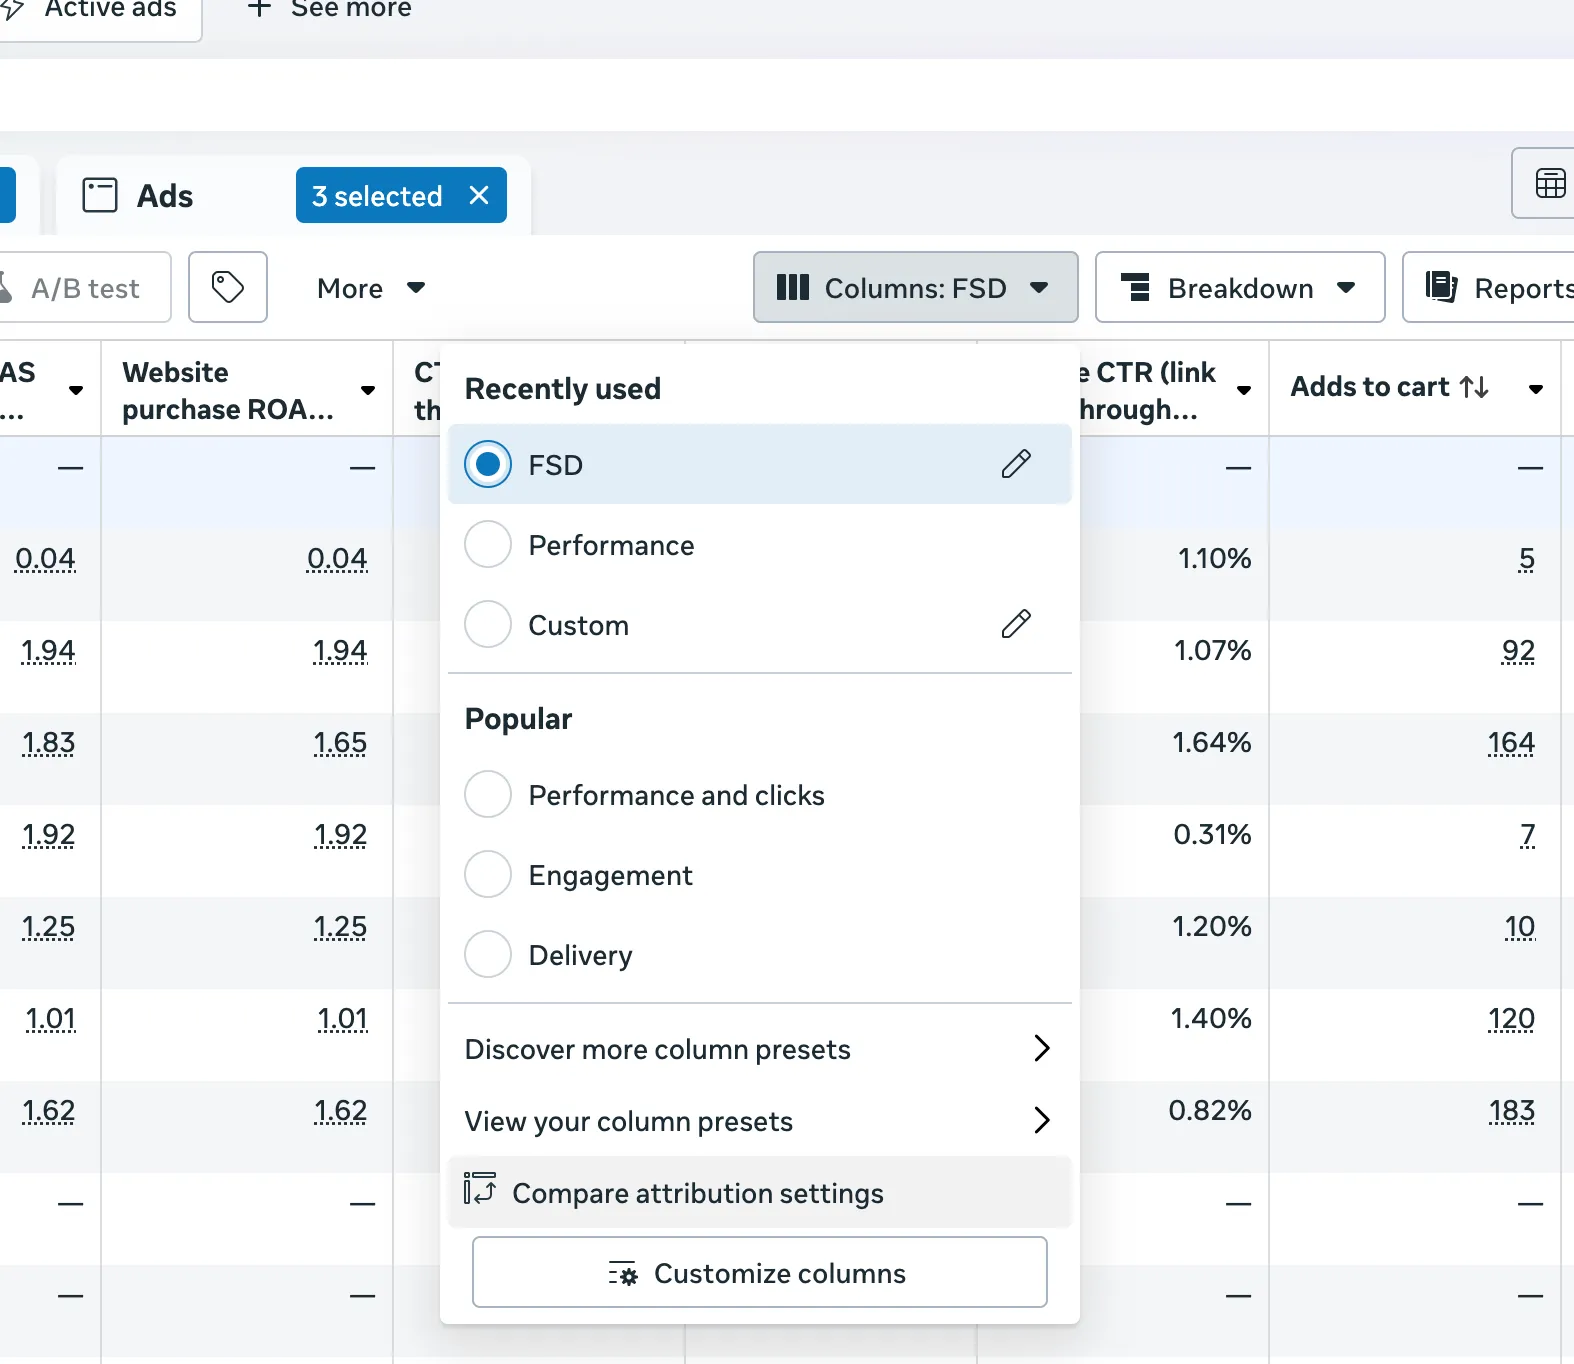
Step 2: Check off every box in this section, and you can leave ‘All Conversions’ for now, and hit ‘Apply.’

Step 3: Review your total Purchases vs. the various attribution setting options.
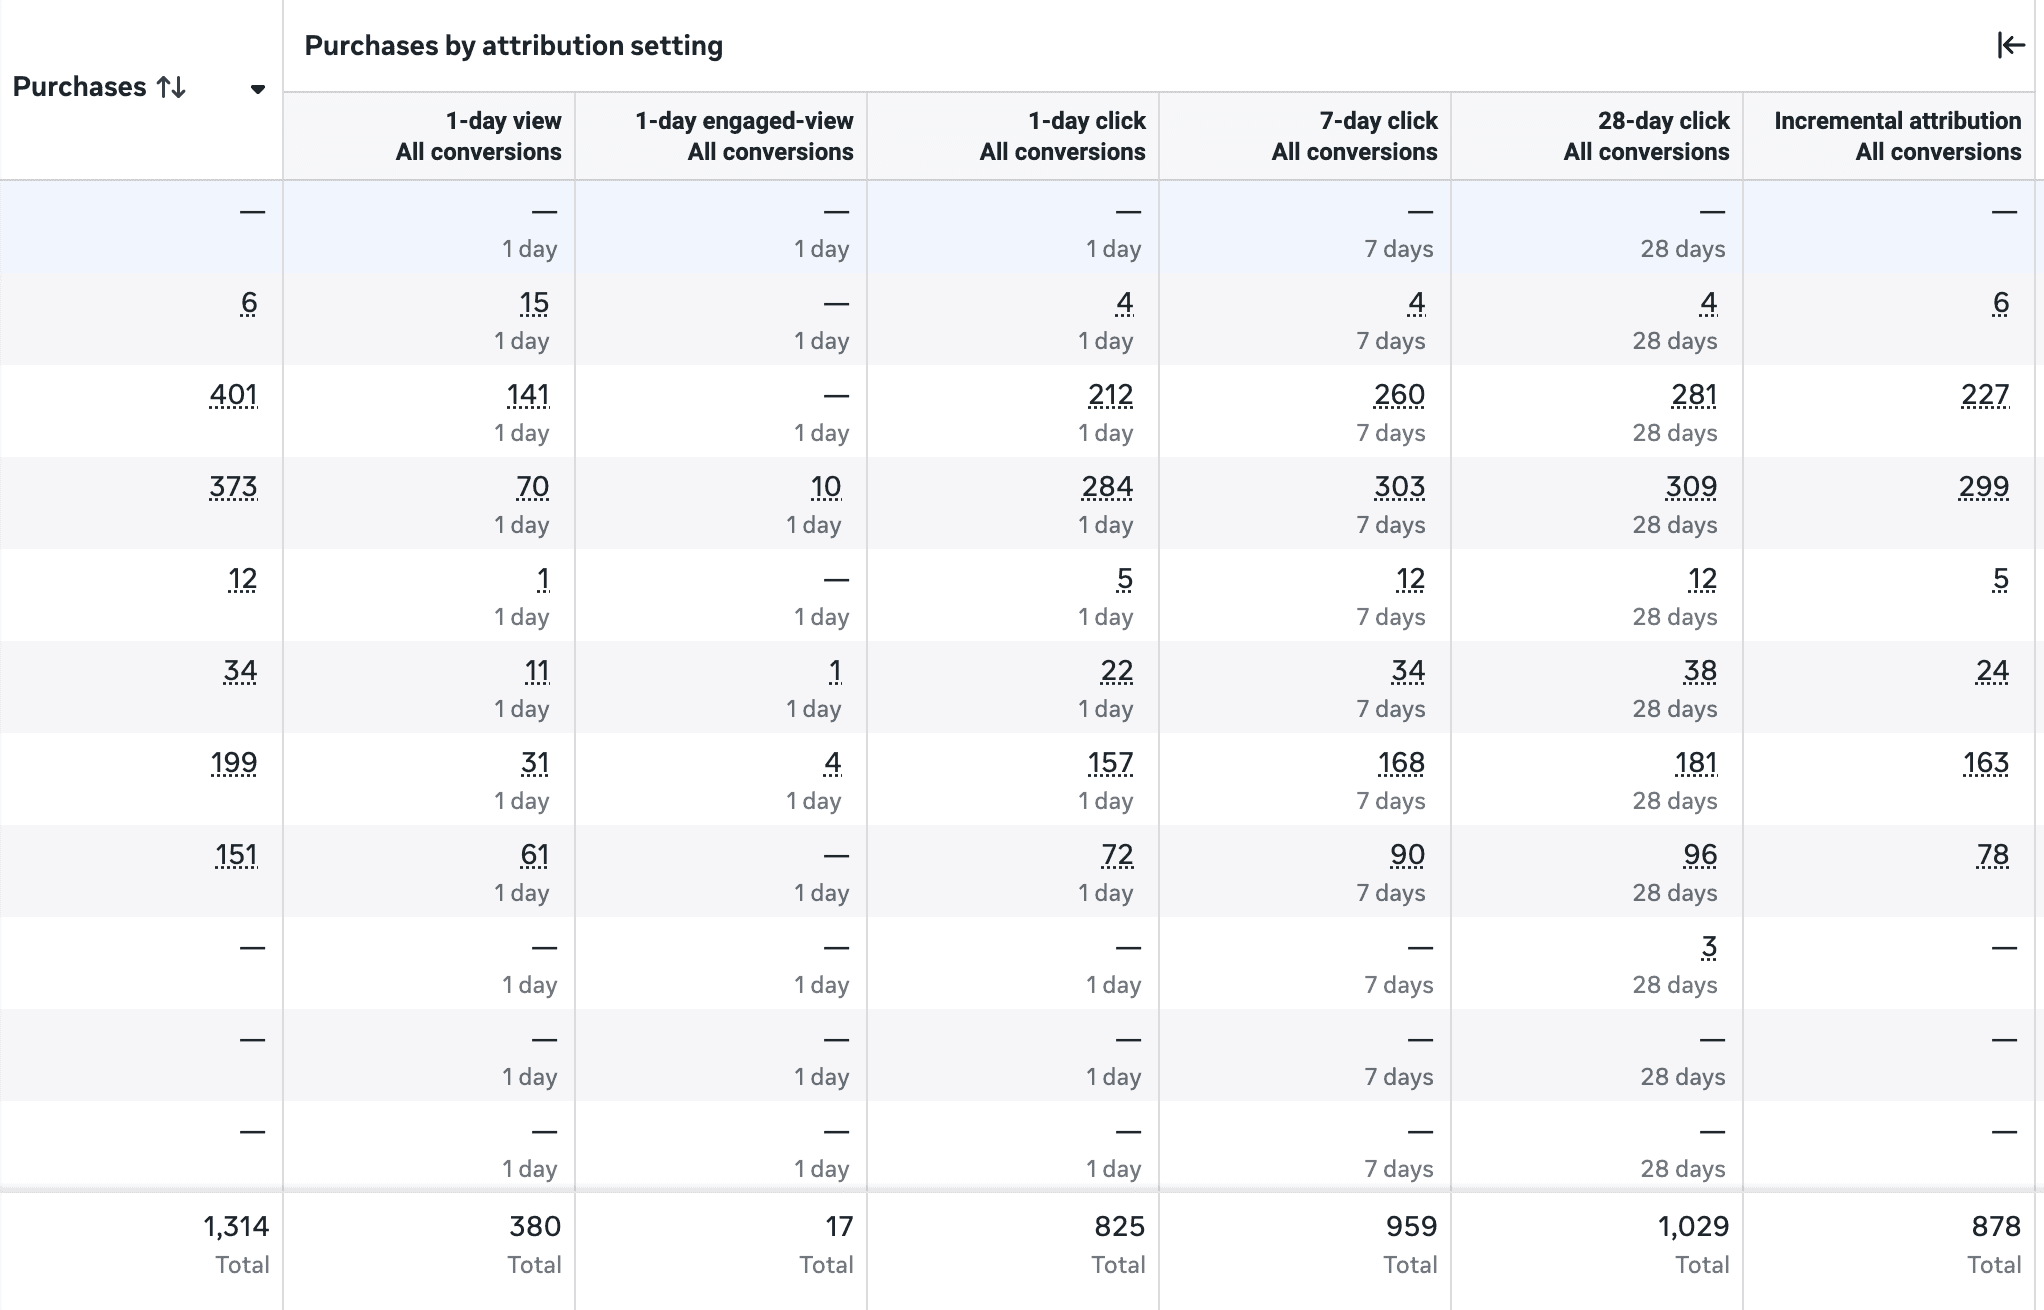
Here’s where the important work comes in. At a glance, I can see 1,314 conversions during this time period, with 397 being 1-day view conversions or 1-day engaged-view conversions (30% of total conversions).
1-day click: 63% of total conversions
7-day click: 73% of total conversions
28-day click: 78% of total conversions
Incremental: 67%
If you’re wondering why these percentages don’t add up to 100%, it’s because the 28-day click conversions includes 7-day click and 1-day click within them. And 7-day click includes 1-day click conversions (since their windows overlap). Incremental conversions are defined by Meta as conversions that are directly attributed to the ad that would not have happened otherwise.
So how do we make sense of this data?
1-day view conversions means a user simply viewed an ad in their feed and then converted as a customer (or lead, signup, etc). Typically these conversions are not as valuable because the user isn’t taking a concrete action like clicking the ad and navigating to a web page.
1-day view attribution simply means Meta served a person an ad, and then that person made a purchase within 1-day of being served. It doesn’t mean the person actually saw the ad or that it even registered in their mind at all, let alone influenced their decision to convert.
This becomes a big issue, because all ad platforms are incentivized to inflate performance and take credit for results.
Meta’s algorithm is trying to maximize results within your budget, so it’s going to serve more ads to people who were already likely to convert anyway. If the user is merely served the ad but was already going to purchase anyway — or they converted on an e-mail or social post instead — Meta ads will still take credit for it (all ad platforms do this).
In short, view attribution isn’t that valuable (in most cases, more on this later), because it’s not an indicator that the ad actually impacted the conversion decision.
In this case, a healthy portion of our conversions are within a 7-day click window, and are also incremental as deemed by Meta.
Having trouble understanding this still? For a more thorough introduction-level breakdown of how attribution windows work, read Jon Loomer’s post about it.
Step 4: Apply Audience Segment Breakdown
Here’s where things get even more interesting (and sometimes heart-breaking if you’ve been spending a lot of money on Meta).
Navigate to the ‘Breakdown’ section and select ‘Audience segments.’
Here’s where things get even more interesting (and sometimes heart-breaking if you’ve been spending a lot of money on Meta).
Navigate to the ‘Breakdown’ section and select ‘Audience segments.’
Here’s where things get even more interesting (and sometimes heart-breaking if you’ve been spending a lot of money on Meta).
Navigate to the ‘Breakdown’ section and select ‘Audience segments.’

This is going to show you Meta’s breakdown of which audiences you’re reaching:
New audiences
Engaged audiences (as defined by your audience settings)
Existing customers (as defined by your audience settings)
As an example, let’s take a look at this campaign with 401 purchases. 62 of those (15%) came from Existing customers (people who purchased in the past), and 339 (85%) came from New Audiences.
This is a great split overall, because we’re using an Advantage+ Sales campaign (ASC) and capping our remarketing spend to existing customers at 20%, so Meta is doing what it’s told. Meta is a powerful acquisition machine, and we don’t generally want to spend too much on remarketing existing customers (that’s why owned channels are for, like e-mail, organic social).
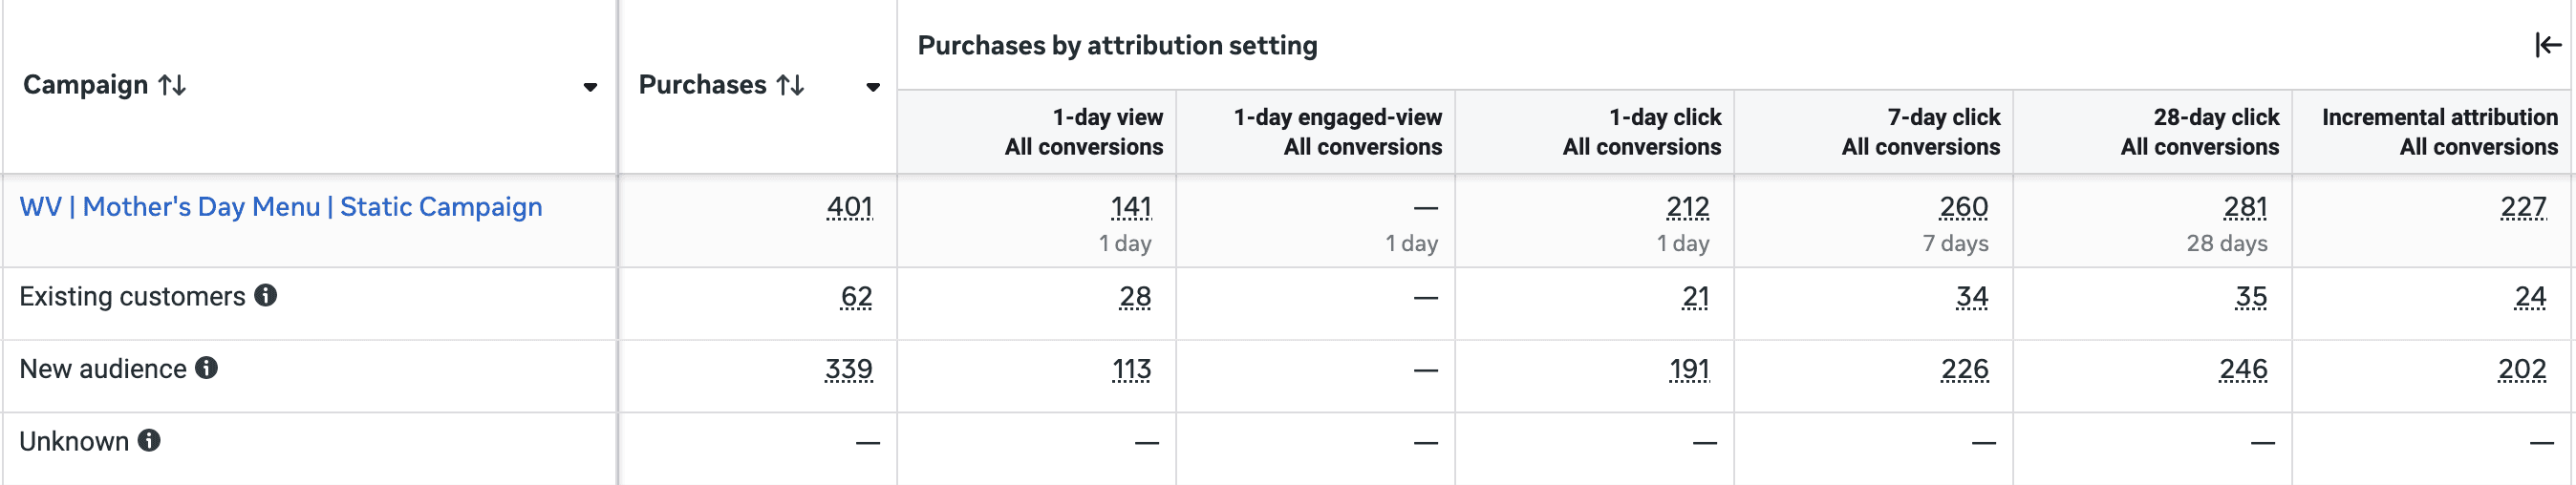
In this campaign, 1-day view conversions of Existing customers account for 45% of total conversions, which often times can be much higher.
33% of total conversions for New audiences are 1-day view conversions, which honestly is higher than I would like. It indicates that these New audiences we’re reaching actually aren’t ‘New’, which is always partly the case. And in this case, the brand has strong retail presence and users very well may be aware of the brand, and prompted to purchase online after viewing an ad.
Typically, it’s a low chance that people who have never heard of your brand view your ad and then go purchase elsewhere without ever clicking the ad. It happens, but you can’t count on a high percentage of these conversions to have the impact you’re imagining (or that your agency is telling you).
There is always a story to tell in the data, and your ads team needs to be looking at every plot point to interpret it correctly and understand where the story is going next. Ads don’t live in a silo, and need to be synchronized with every department and target business outcome.
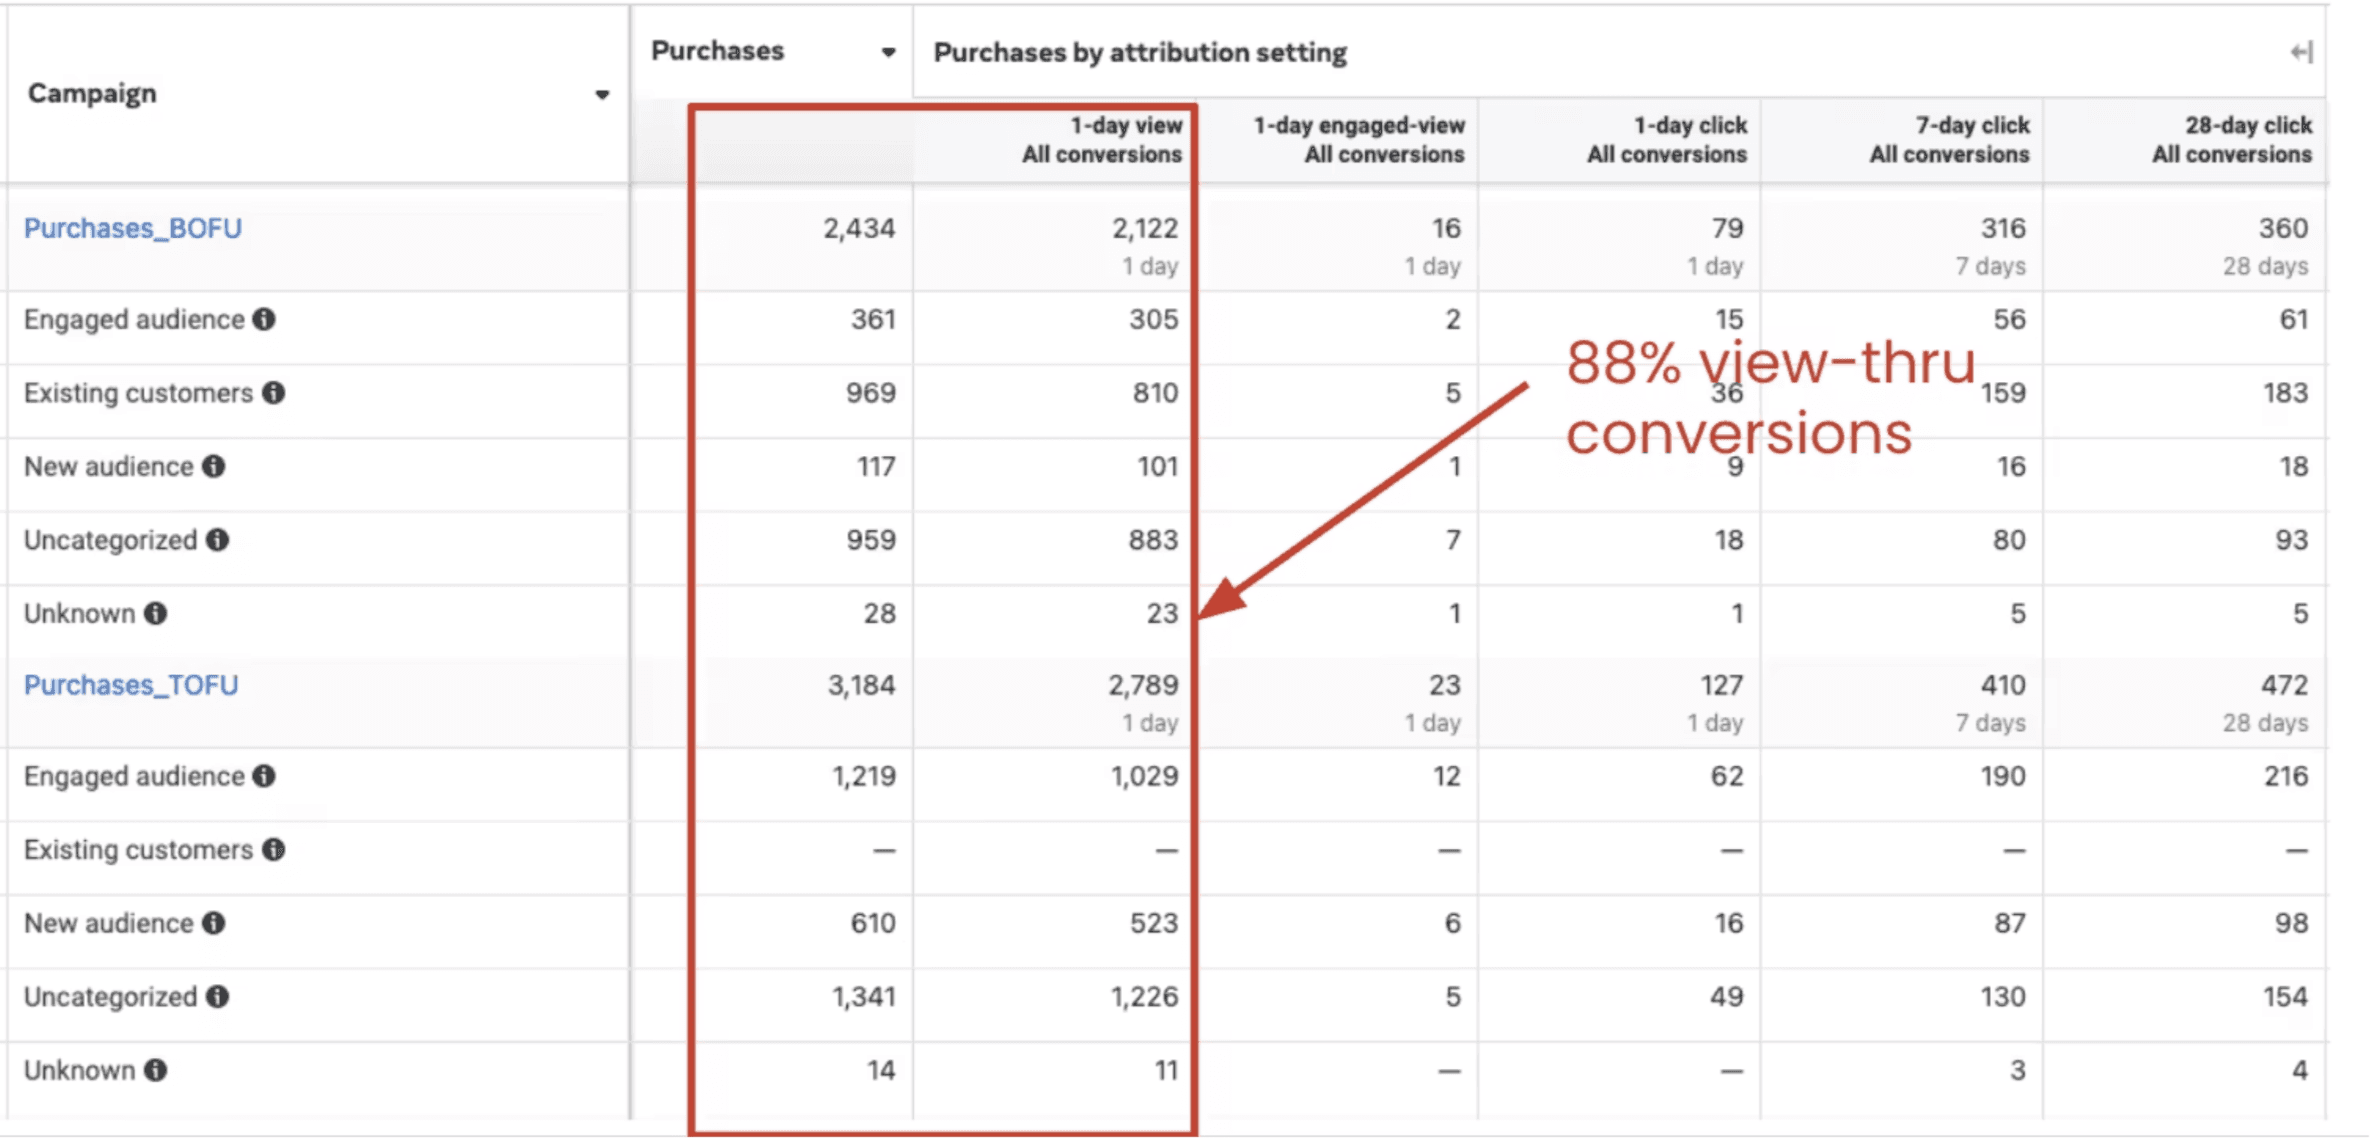
Here’s another example of an ad account I audited. I noticed that there were 88% 1-day view-thru conversions on a prospecting campaign, at that. And most of these were to Engaged audiences (defined as web visitors in the past 180 days, in this case).
In this campaign, 1-day view conversions of Existing customers account for 45% of total conversions, which often times can be much higher.
33% of total conversions for New audiences are 1-day view conversions, which honestly is higher than I would like. It indicates that these New audiences we’re reaching actually aren’t ‘New’, which is always partly the case. And in this case, the brand has strong retail presence and users very well may be aware of the brand, and prompted to purchase online after viewing an ad.
Typically, it’s a low chance that people who have never heard of your brand view your ad and then go purchase elsewhere without ever clicking the ad. It happens, but you can’t count on a high percentage of these conversions to have the impact you’re imagining (or that your agency is telling you).
There is always a story to tell in the data, and your ads team needs to be looking at every plot point to interpret it correctly and understand where the story is going next. Ads don’t live in a silo, and need to be synchronized with every department and target business outcome.
Here’s another example of an ad account I audited. I noticed that there were 88% 1-day view-thru conversions on a prospecting campaign, at that. And most of these were to Engaged audiences (defined as web visitors in the past 180 days, in this case).
This is way too high. And what’s clearly happening here is that Meta is spending a ton of money on warm audiences who already visited the company website and are aware of the product/service, and then it’s counting those as conversions after simply serving them an ad. It’s likely that most of these people would have converted anyway from another source, and Meta just snuck in an impression into their feed to steal some of the credit.
This is a huge deal, because if you were only to look at the default ROAS metric, you’d see a 7.36 and be saying “scale it to the moon!”
But in reality, if you look at the breakdown of ROAS based on attribution setting and audience segment, New customer ROAS for 28-day click attribution is a 0.74, and only 0.29 for Incremental attribution. For Engaged audiences it’s only a 1.38 28-day click ROAS.
So out of the people who are actually clicking ads the ROAS is pretty abysmal.

You might be thinking, “but what about the ‘Halo Effect’ and brand awareness and all the conversions that Facebook doesn’t track?
Yes, all these things are real and factors to consider. But if you’re running a brand ad with the goal of brand awareness, you need to execute that in a specific way, with specific ad creative, and also measure in a specific way.
Most CEOs, CMOs, VP of Marketing, etc, are even aware of how their team is measuring these different objectives. For conversion-oriented campaigns, the cold matter-of-fact is that getting a high amount of 1-day view thru attribution is just fugazi numbers, they aren’t real, and your UGC and static ads likely aren’t building some big Halo Effect of brand affinity that is adding to your bottom line on some other channel that your team or agency isn’t measuring…see what I’m saying?
Here’s a another snapshot of a breakdown of spend by audience segment. Notice that for a ‘prospecting’ top-of-funnel (TOFU) campaign, the majority of spend is reaching warm audiences!
This is something I see in account audits all the time.

Let’s wrap up what we learned in this section:
We need to view audience segment breakdown to make sure prospecting campaigns are actually prospecting. Making sure proper exclusions are set in our audience section is crucial.
Attribution windows tell the story of impact, especially when combined with audience segment breakdown. 1-day view conversions typically don’t have a high confidence value in terms of the impact it had on buying behavior.
1-day click, 7-day click, 28-day click are good attribution windows to look at for how long it takes a user to convert after clicking an ad. You can map these to your sales cycles and optimize different audience segments for different attribution windows based on known sales-cycles.
Incremental attribution is a new setting by Meta to help track when an ad was the direct reason that someone converted.
Understand the True Impact of Marketing
In this section we’ll talk about the next level of measurement that is directly related to bottom-line business outcomes, not just ad platform reporting. In an age where attribution is messy, and not all things can or should be tracked directly, it’s more important than ever to align business outcomes with your media buying strategies.
This isn’t the deepest level you can go into your attribution and tracking, but it’s a good start that most brands aren’t doing, and ultimately these are going to be some of the most important metrics your business tracks, and your ads team should be aligned.
Defining the terms:
MER (Marketing Efficiency Ratio):
→ Measures blended efficiency across all channels.
Defining the terms:
MER (Marketing Efficiency Ratio):
→ Measures blended efficiency across all channels.
Defining the terms:
MER (Marketing Efficiency Ratio):
→ Measures blended efficiency across all channels.

aMER (Acquisition Marketing Efficiency Ratio):
→ Measures your ability to acquire new customers profitably.
aMER (Acquisition Marketing Efficiency Ratio):
→ Measures your ability to acquire new customers profitably.
aMER (Acquisition Marketing Efficiency Ratio):
→ Measures your ability to acquire new customers profitably.

Contribution Margin:
→ Shows what’s left over after variable costs like COGS, shipping, and payment fees.
Contribution Margin:
→ Shows what’s left over after variable costs like COGS, shipping, and payment fees.
Contribution Margin:
→ Shows what’s left over after variable costs like COGS, shipping, and payment fees.

New Customer ROAS:
→ Helps track the quality of top-of-funnel efforts.
New Customer ROAS:
→ Helps track the quality of top-of-funnel efforts.
New Customer ROAS:
→ Helps track the quality of top-of-funnel efforts.

CAC:LTV Ratio:
→ Answers: is this customer worth the cost of acquiring them?
CAC:LTV Ratio:
→ Answers: is this customer worth the cost of acquiring them?
CAC:LTV Ratio:
→ Answers: is this customer worth the cost of acquiring them?

Customer Payback Period:
Time it takes to recoup CAC through gross profit
→ Shorter = healthier growth.
Customer Payback Period:
Time it takes to recoup CAC through gross profit
→ Shorter = healthier growth.
Customer Payback Period:
Time it takes to recoup CAC through gross profit
→ Shorter = healthier growth.
MER and aMER - What are they and how to calculate them
Marketing Efficiency Ratio (MER) is calculated by taking total revenue derived from marketing, and dividing it by your total marketing spend over any given time frame.
MER = Total Revenue/Total Ad Spend
Another way to think of MER is how “Effective” your paid media is.
What MER allows you to do is abstract away attribution and answer the question: how many revenue dollars are being generated for every dollar in ad spend?
Marketing efficiency rating exists to measure every ad dollar out against every revenue dollar in. It answers the big-picture question: How much did we make based on how much we spent?
It’s a key metric to understand the overall health of your marketing and help you strike the balance of how much to spend on advertising.
Acquisition MER is calculated
Acquisition marketing efficiency rating (aMER) is calculated by dividing new customer revenue by total ad spend.
This tells us how efficient we are in acquiring new customers. CTC does a much more thorough breakdown of aMER in this article.
Why MER Alone Won’t Tell You If Your Ads Are Working
MER gives you a nice-looking number:
It’s great for looking backwards. It’s terrible for figuring out what to do next.
Why? Because it tells you nothing about:
Whether those sales came from new customers
What your margin looked like
How fast you're making that money back
Without those layers, MER is just an illusion of efficiency.
The Only 3 Metrics to Track Weekly
1. Blended MER
Use this as your gut check. If your blended MER is under 2 and your margin is thin, you're likely unprofitable. But don’t stop here—it’s a dashboard metric, not a decision-maker.
2. aMER (Acquisition MER)
The better signal. aMER isolates new customer revenue, showing whether your media spend is acquiring new buyers or just re-engaging your loyalists.
If blended MER is stable but aMER is dropping → you’re relying on returning customers.
If aMER is healthy and rising → your funnel is working.
3. Marginal aMER
This is where real media buyers live. Ask:
What did the last $10K in ad spend actually return in new revenue?
Plot spend vs aMER in tranches. That shows your scaling ceiling—the point where adding more budget just adds more waste.
What About Profit?
Now let’s talk about what really matters: are you making money or not?
To calculate this, you need to factor in contribution margin. If your margin after variable costs is 50%, then your breakeven MER is:
Now let’s talk about what really matters: are you making money or not?
To calculate this, you need to factor in contribution margin. If your margin after variable costs is 50%, then your breakeven MER is:
Now let’s talk about what really matters: are you making money or not?
To calculate this, you need to factor in contribution margin. If your margin after variable costs is 50%, then your breakeven MER is:

If margin = 50%, breakeven MER = 2.0
This is where you can start to layer in Net Profit to your measurement stack:
If margin = 50%, breakeven MER = 2.0
This is where you can start to layer in Net Profit to your measurement stack:
If margin = 50%, breakeven MER = 2.0
This is where you can start to layer in Net Profit to your measurement stack:
CAC:LTV and Payback Period: The Real Growth Levers
CAC:LTV Ratio
Your goal here is a ratio of 1:3 or better. That means for every $1 you spend to acquire a customer, you earn $3 over their lifetime.
This is where retention and post-purchase strategy matter. A great CAC doesn’t help if LTV is capped at $40.
Payback Period
This is the one VCs care about—and you should too.
If it takes 6 months to break even on CAC, you’re tying up cash and risking churn. If your payback period is under 60 days, you’re in a strong position to reinvest and scale.
How This All Comes Together
Use this framework weekly:
Use this framework weekly:
Use this framework weekly:
Metric | What It Tells You |
|---|---|
MER | Overall blended efficiency |
aMER | Net-new customer efficiency |
Marginal aMER | If incremental spend is profitable |
Contribution Margin | How much revenue is actually usable |
New Customer ROAS | TOF effectiveness |
CAC:LTV | Long-term growth health |
Payback Period | Cash cycle risk |
You Can’t Fix What You Don’t Track
If your agency or internal team can’t tell you the:
Contribution margin by campaign
CAC payback window
New vs. returning customer ROAS
Incrementality by channel
...then they’re flying blind. And so are you.
Here’s what we do instead:
We build a measurement stack tailored to your business.
Not a generic ROAS dashboard. A system that ties Meta ad spend to bottom-line results. That shows your exec team the full CAC > LTV > Profit pipeline in real time.
We audit your campaigns through a business lens.
We don’t just look at ROAS. We dissect the economics of every funnel, offer, and segment.
We help you build high-impact creative with measurement in mind.
Testing isn’t just about CTRs and hooks—it’s about acquiring the right customer at the right cost.
Final Thought: The Ads Aren’t Broken. The Lens Is.
If your ads aren’t “working,” maybe it’s not the copy. Or the targeting. Or the algorithm.
Maybe it’s what you’re measuring.
And maybe what you really need isn’t a new media buyer—but a new mental model. One that puts your business first, your customer second, and your vanity metrics dead last.
That’s the model we run.
Let’s build yours.
Want Us to Audit Your Ad Strategy?
We’ll break down how your ad dollars are (or aren’t) driving real profit. Free audit, no fluff. Just clear, actionable insight.
We’ll break down how your ad dollars are (or aren’t) driving real profit. Free audit, no fluff. Just clear, actionable insight.
We’ll break down how your ad dollars are (or aren’t) driving real profit. Free audit, no fluff. Just clear, actionable insight.
Find this article helpful?
Share with a friend.
Find this article helpful? Share with a friend.
Find this article helpful? Share with a friend.
© 2024
© 2024
© 2024
© 2024
© 2024